
Today, we’re going to talk about the difference between the logarithmic scale and the linear or arithmetic scale. The reason I mention it is I get very often the question of why I use the log scale, and this is a live stream dedicated to that. Of course, we are also taking a look at charts and chart requests, which we do every Sunday for members. So if you’re interested, you can find the link in the description to the membership.
Analyzing the Short-Term Bitcoin Chart
Let’s go Bitcoin! I only want to show you the short-term chart, but we will take a look at some indicators as well. I want to focus only on the short-term chart. The reason is that in my last video yesterday, I looked at the daily chart, and I normally do that once a day. Yesterday, I actually did it twice. So let’s take a look at the shorter time frame here, which is the 30-minute chart.
July 5th Low and Five-Wave Pattern
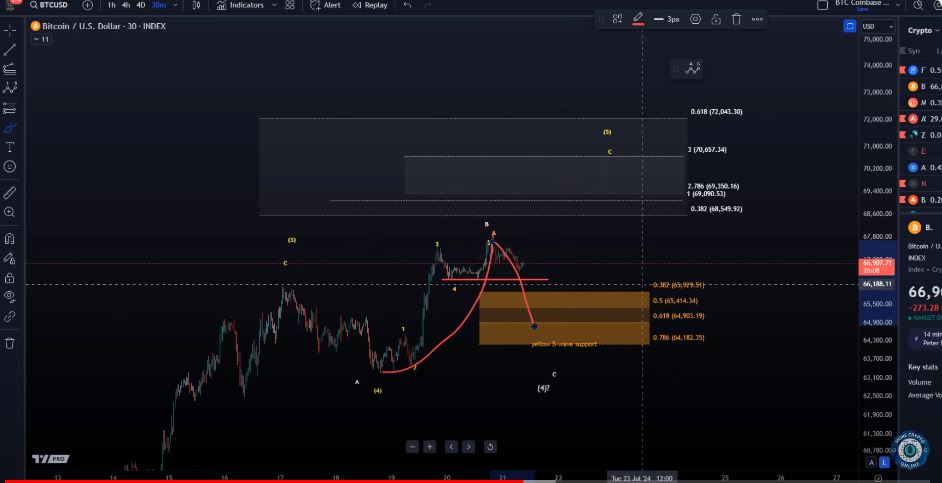
We will examine the movement from the 5th of July low, which has formed a five-wave pattern to the upside. There are a couple of possible interpretations here. What is really important, and I think that’s really the most important thing, is that we can now identify that five-wave pattern to the upside that we’ve been watching for since the 5th of July as a first confirmation that we have a lasting low in place on the 5th of July or since the 5th of July. While I’ve been tracking higher prices and support levels have held throughout, I could not confirm to you that a low is in place until the five-wave move to the upside would unfold.
Comments on the Five-Wave Move Up
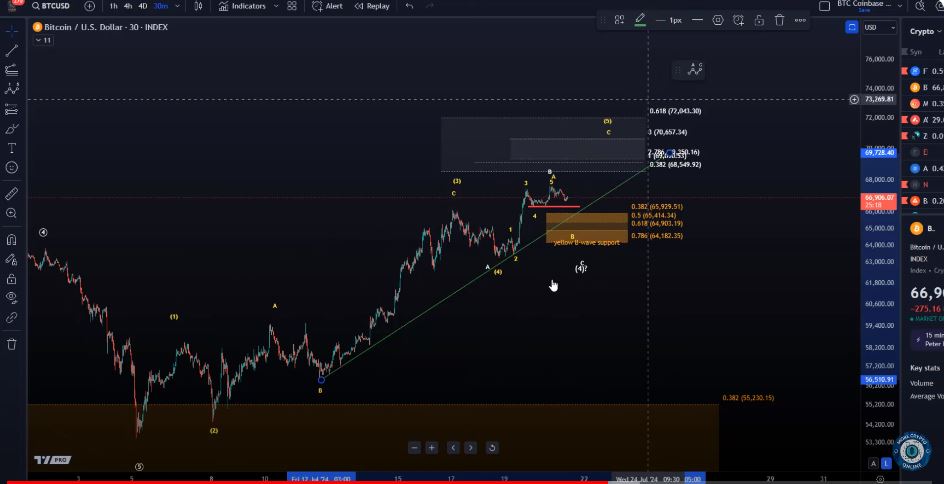
Now, this comes with some comments. Obviously, it’s not a clear five-wave move up yet. I’d like to see another push into the 68,000 to 69,000, ideally even 70,000 area, so a fifth wave, which might very well be unfolding already. It’s a five-wave move in a Diagonal pattern, which should reach sort of an area a little bit closer to 70,000. We haven’t seen that yet, so it’s still possible there are a couple of other interpretations. For example, that this is still a fourth wave that’s unfolding and then we get the last push a little later, or if the next larger pullback occurs, it might already be the wave two.
Possible Scenarios and Support Levels
Quick explanation: if we say that this is a five-wave pattern to the upside, maybe it’s already finished. Ideally, it should push a bit higher, which would be my preferred scenario, either directly or after another pullback. But okay, if we break support levels and come down deeper, then I would give the Bulls the benefit of the doubt and watch for a wave two correction because the five-wave move up would be called a wave one, and the pullback would then be a wave two. If the pullback is too deep to still be part of an unfolding fifth wave or wave four leading to a wave five a little later, yeah, so if we get a deep pullback from here, I would first watch if it’s a wave two.
Wave Count and Indicators
I would only do that because, on the larger time frame, zoomed out, we can already recognize five waves. But ideally, we push a little bit higher before we see that deep pullback because the five-wave move up that we’ve already seen, which is an Elliot Wave, is always a confirmation that the trend is up. That’s not ideal yet. I would like to see it reach at least the minimum targets for a fifth wave, and they start at $68,500.
Analyzing Support Areas and Trend Lines
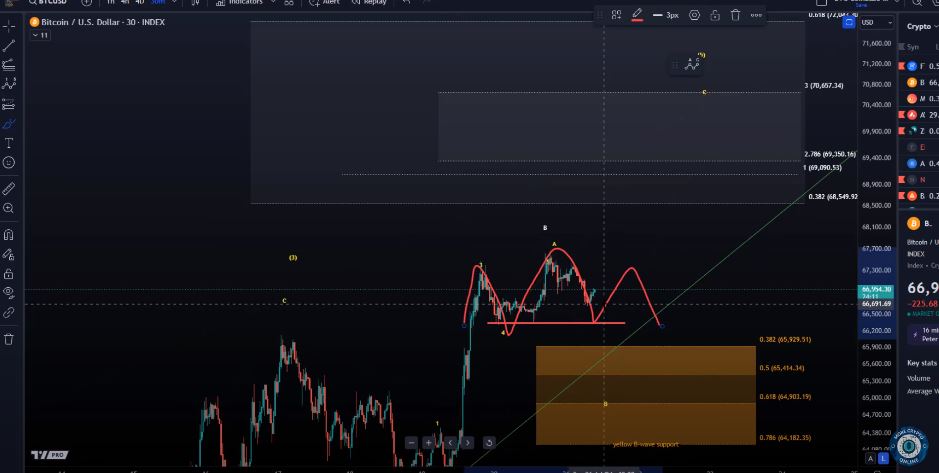
So what can we track here? Something is interesting. First of all, I mentioned to you already the wave count, okay, five waves up. Quickly, before we take a look at other indicators, the move up from the 18th of July low, so from the Thursday low, seems to be a five-wave move. We can call that wave A of five in one interpretation. We can watch for a B-wave pullback in that wave five. The support area hasn’t changed since yesterday, so if we get a pullback, the first area of support is between 64,800 and 65,829. But to get a pullback, we first need to see a break below the red line at 63,000, no, 66,350. Without a break of 66,350, there is no sign that a pullback has started. So before we even entertain the idea of a pullback, we should see a break of that level. Then a pullback, then we can watch this support region. Maybe one more extension higher. If we see this support area break, then we can think about a larger top being in place.
Additional Indicators to Watch
- But let’s take a look at some other indicators.
- First of all, I think we can add a trend line.
- Let’s just double-check that.
- This one is not so useful, I mean, two touch points.
- This here seems a bit more relevant.
- It has a few more touch points.
- We have three to four touch points down here, another one here, so that could act as additional support.
- A break of the trend line could be a signal that we have formed some kind of a top.
- As you can see, it’s overlapping with that support zone, so we would have to see.
- It’s just something to watch because trend lines with many touch points can be interesting signals when they break.
- They’re not so much related to Elliot Wave, but you might remember that setup I showed you here with the three to four touch points we had on this trend line, and it was a nice breakout signal.
- So I just want to show you that trend line.
- Some people try to trade with trend lines.
- It’s just one thing to watch.
Possible Head and Shoulders Pattern
Another thing is that as long as we stay below yesterday’s high, which formed at 67,640, this could be a head and shoulders pattern: left shoulder, head, right shoulder. So again, does it make a difference if I call it head and shoulders or if I just say the 66,350 level is key support? Because if we break below it, it likely means we test at least this support region. But pay attention to that; it could turn into a head and shoulders, which would be invalidated with a break above yesterday’s high.
Reviewing the 1-Hour Chart Indicators
| Observation | Description |
|---|---|
| We should go to the 1-hour chart. | These indicators are a bit more reliable. |
| Looking at that, on the 1-hour | We have here a bearish divergence. That shouldn’t be a surprise given that we have five waves up, also from the Thursday low. |
| After five waves up | We often see bearish divergences. A third wave typically shows the highest reading on the RSI, and the fifth wave forms a lower high on the RSI. So it’s just something to watch. |
| The 4-hour chart | Also shows bearish divergences. So that is now getting really interesting. We are still embedded in the bullish range, though, on the 4-hour. |
| MACD on the 4-hour | Has crossed bearish. So I think we are getting some additional signals that we could be close to tops, tops of sorts. I mean, just crossing bearish on the 4-hour, as you can see here, |
| Happened before on Wednesday | All it meant was a pullback, so that’s just something that means be on high alert. We could get a pullback from this region. But again, it’s only an indicator. |
| Price confirmation | The price needs to confirm that. How would the price confirm that? With a break below 66,350. |