
What’s up guys and welcome back to another video. So in this video, I’m actually going to be talking about how to make $100 per day trading either Bitcoin or altcoins.
I made on this topic actually got over 1.1 million views, so I thought it’s been a few years it’s time to refresh and update that video with some new practices and also some better techniques.
There are so many more altcoins out there right now in the market and I think there are much better ways we can actually be going out there and making profit from trading them. So in today’s video, I’m going to be going through some techniques on how you can find these coins to trade on CoinMarketCap and other websites.
How you can, in fact, trade them using platforms like Binance, Bybit, Femex, and also how you can chart them as well on TradingView. I’m going to be telling you all that information completely for free. All I ask for you in today’s video is simply to drop a like and that would be absolutely amazing.
So guys, without any further ado, let’s jump into the chart. So let’s jump into the computer and get on with today’s video. Alright guys, so now
Coin Market Cap
We are in the computer. If you haven’t already, definitely subscribe to the channel. I’m going to be posting so many more tutorials like this and also almost daily Bitcoin and altcoin analysis. So definitely subscribe, you don’t want to miss out
So right now we are on a website called CoinMarketCap. If you don’t know what this is, this basically aggregates all the different cryptocurrencies out there and it lets you see price action movements, information about them, and everything like that.
So CoinMarketCap is pretty much where I start my day. I always log on to CoinMarketCap in the morning and check the prices, check my portfolio as well. You can track your portfolio on here and overall just have a look at the general health of the market.
One of the great things about CoinMarketCap though is you can search by 24 hours or you can filter and sort by 24 hours and seven days. For example, here we can see Celo has gained 24 percent. That’s the highest gainer today in the last 24 hours and we can also check on seven days as well. The highest gainer here again is Celo. We have Dai and Quant as well.
Yeah, basically that’s what we can do there. Also, we can select the losers here for down 41 percent, down 35 percent on seven days, and on 24 hours down 7 percent, down 6.5 percent as well. This is where it starts to get very interesting and this is usually how I go about finding the coins which I want to trade.
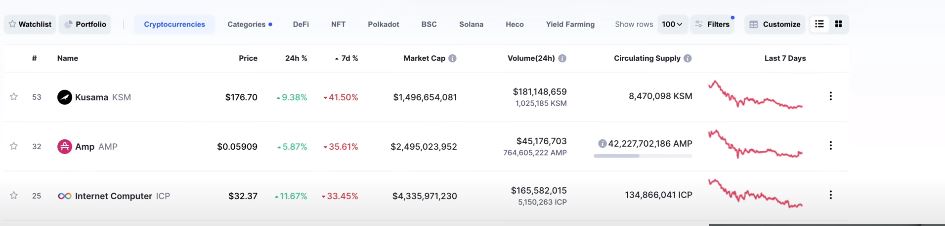
One of the things, if we can select a coin on the seven-day chart which is actually down by quite a lot, this could potentially reveal a buying opportunity. Right here we can see Kusama, AMP, Internet Computer, Near, Portugal, Phantom, Ravine, Horizon, Neo, Polkadot as well. Some of these coins are even really good.
Like Polkadot’s ranked number nine. We have Neo, we have AMP here, we have Kusama. All these coins are great coins. Ontology, Nexo, Aave, ThorChain, all these coins are great, great coins. It’s not like we’re trying to trade bad coins or anything like that. These are all coins with a huge market cap which you can see right here.
Also, we want to check out the volume as well. Volume, I like to have a decent amount of volume, at least around 50 million or 30 to 50 million at least. Here we can see we have 180 million, 45 million, right here 165 million. All of these have plenty, plenty, plenty of volume.
Here we have around just below four million which definitely is on the lower side of things. Probably I wouldn’t want to go ahead and trade something like that. It depends really on how much you’re trading with. You can get in and out on trades, but if the volume is lower it’s going to be more difficult if you make a lot of profit to in fact get out of that trade. So that’s the first thing you want.
Cryptobubbles
To do, you want to go to CoinMarketCap and identify the altcoin which you want to trade. Also, there’s another website which makes it a little bit more fun. It’s called Cryptobubbles.net and you can go over here and select for example the hour, you can select the day.
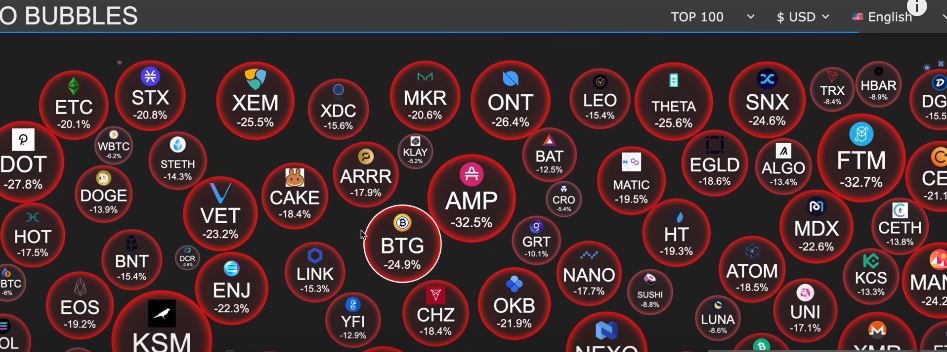
Right here it makes it a little bit more fun. For example, if we click on LINK right here, we can see the chart overall here trending downwards. We can see the volume, the rank, and everything like that. So it’s a really interesting chart to see here on the day. Also the week, we can see as well, for example, if things are down in the week.
- Now in the markets as I’m filming this, we’ve had a fairly rough week.
- We can see many things down 20 percent and more.
- For example, Theta down 25 percent, LINK down 15 percent, KSM down 42 percent.
- So we can see a lot of opportunities here in the market.
- If we go on the month, we had a few different green ones but nothing really too crazy.
- And on the year, most likely we’re going to be all green.
- Yeah, we can see we’ve had a huge year.
- Look at DOGE here, right here, 10.5 thousand percent up, which is absolutely crazy.
- So then what we want to do is go ahead and find ourselves a coin to trade.
- One thing I did want to point out though guys before we get any further in
Bitcoin Blueprint
Today’s video, if you want more knowledge about how to trade, if you want more advice, more strategies, more techniques, if you want the support that you need to in fact go ahead and make profitable trades, link down below. I have my Bitcoin Blueprint and this is pretty much your A to Z guide on how to make money with cryptocurrency, how to trade for long term and day trade, swing trade, how to invest for the long term as well in cryptocurrency.
In here we’ve had already thousands of students and successful students as well and I would really welcome you to go ahead and check out the link down below in today’s video. You can even book a free strategy and assessment call with Ben, our student success manager, or Marty as well.
And you can go ahead and talk about the blueprint for 20 minutes on a completely free call. All that will be linked down
Binance Tutorial
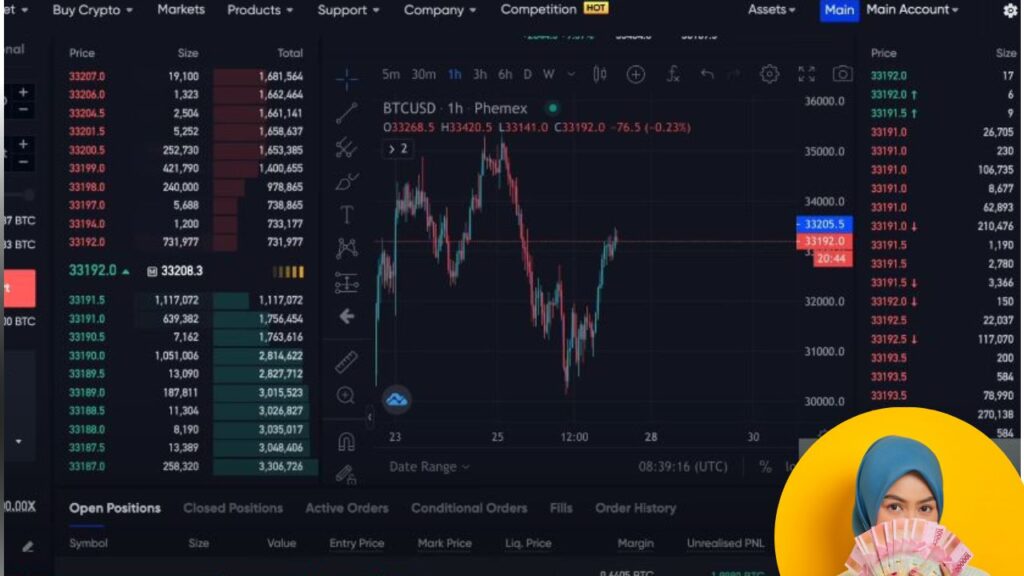
Below also guys, all the exchanges featured in today’s video. We have Binance, we have Femex as well, where I have a trade open in around 66,000 US dollars in profit and we have Bybit as well.
All of these different platforms have bonuses. For example, Bybit right now around 1,600, Femex is around 200 bonus. Binance as well, that will be updated and linked down below. All these exchanges have bonuses and in order to get those bonuses all you have to do is join using my link down there. I get a bonus, you get a bonus, everyone’s happy and hopefully we can make some profitable trades.
So for example, what you want to do is go over to CoinMarketCap here and sort by seven days. Right here we have Kusama right here and if you want to click on that like that, you want to see which exchange it’s hosted on. For example, go down here and click market and then when that loads you can see okay, the most the highest volume here is on Binance and it’s in a USDT pairing.
So then what you would want to do is you want to simply go over to Binance, you’d want to go over and make yourself an account if you haven’t already with the link down below. Click advanced like so, this will bring up the exchange. If you haven’t already watched my tutorial on Binance, Femex, or Bybit, all those will be linked down below as well and available on my channel completely free.
| Step | Description |
|---|---|
| 1 | We then click up here and we want to find the identifier for Kusama which is KSM. |
| 2 | So then we simply type in up here KSM then KSM USDT, that’s the pairing we want. |
| 3 | And we can see here it’s had a fairly, we see lower highs right here, we see lower lows as well. So it’s looking fairly bearish. |
| 4 | However, when we pull up the charts in just a minute we could see or we might be able to see if there is an actual buying opportunity here. |
| 5 | So next we want to go over to TradingView. |
| 6 | Right now I’ve got the Bitcoin price open as I’m filming this. The price is 33,000 however we want to focus on the asset of choice right here which is KSM. |
| 7 | What you want to do is if you haven’t already got yourself a TradingView account as well, you can go ahead and get one. |
| 8 | I believe I do have a link down below as well if you want to help out the channel but you can use it for free or if you wanted to use more indicators then you can go ahead and get yourself a pro. |
Using Indicators
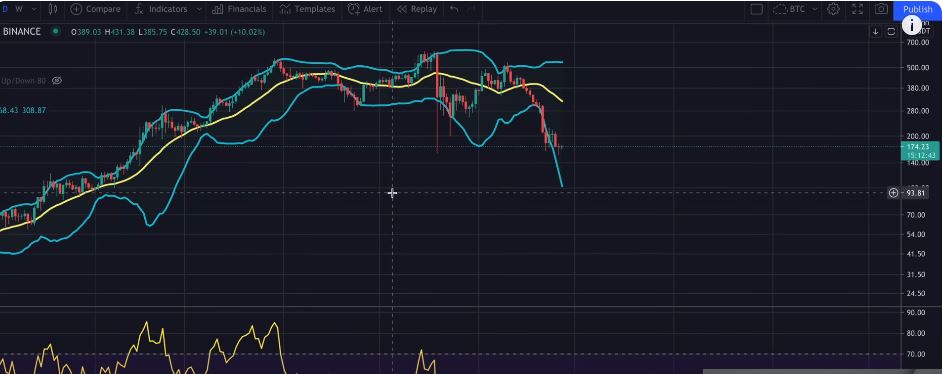
Account. Then we type in here KSMUSDT like so KSMUSDT and it’s on the Binance exchange. Let’s click that and take a look at the chart. Then the first thing that we’re going to do once we open this chart is go to the four hour chart as that gives us a lot of information on our easy to manage time frame.
Now this is where the interesting part comes in. If you want to make a hundred dollars per day you have to be in and out of a trade within the time frame of one day. Of